
Auto-generating graphs
The kitten is small, but growing. It would be nice to track that & convenient to use the telegram bot to do it, but there is a snag... While I can write to a file via NodeRed there is no way (outside of NodeRed) to turn the data (date:weight) into a nice graph.
I'm running my docker host on Linux, so there is a nice command line option for creating graphs (gnuplot). I can feed that some data & get a graphic out, so that I can send it as a "photo" in telegram. There's still the issue of actually running gnuplot when I want it to handle a new data point..
So here's my solution
As usual it may not be the best, but it does work & does it on demand ("live") rather then waiting for a timeout/cron job to get to it.
Step 1: create a telegram bot command for adding data & another for requesting a graph, with the permissions set as you want them. (My access control system is here)
Step 2: Add the commands to the main telegram bot flow, so that they are recognised, processed & passed into the big choose box that redirects the bot commands to the right place.
Step 3: handle the commands :)
Adding a data point
We can be pretty sure that the weight that is added will be from today, so actually all that we need to pass into the bot is the actual weight. We can also be sure that if no other data has been added that the graph can be created once there is new data & then left alone, to be sent if needed & overwritten when there is another weight added to the dataset.
Gnuplot is happy with plain text data files, so that keeps things simple.
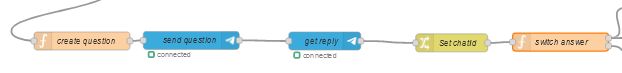
This is the start of the data addition process. I've cut out the access control part, so the first thing that you can see is the response to the command "/addweight"
That first function node contains
msg.payload.type = 'message';
msg.payload.content = 'What is the current weight (kg). Reply "no" to cancel';
msg.payload.options = {reply_to_message_id : msg.payload.messageId}
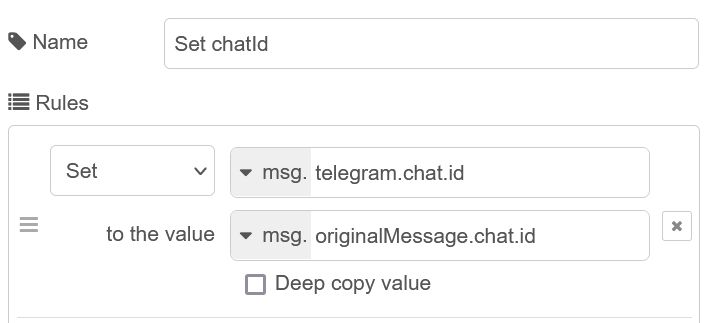
return [ msg ];The sender & reply nodes are pretty obvious (& have no real config apart from picking the telegram bot). The next node just fixes the chatId & the one after just decides which way to go, depending on whether data was added, or the process was actively aborted
if(msg.payload.content === 'no')
{
    return [null, msg];
}
else
{
    return [msg, null];
}
At this point I have to admit to being a bit lazy: there is no attempt to get a date for the measurement & no actual checking that it's a number that's added. Nor is there a way to edit the data once it's there. I've got access to the server & can edit the file if I need to!
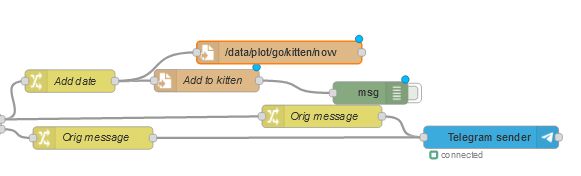
The "Add date" change node sets msg.payload using a JSONata expression to "$fromMillis(1000 * originalMessage.date, '[D01]/[M01]/[Y0001]') & " " & payload.content" i.e. it adds the date!
Finally, for this to work we need to append the new information to the data that will create the graph.
That's the "Add to kitten" node. It's a file write node, with the "Append to file" action & with "Add newline (\n) to each payload?" ticked. Remember, our payload was the reply to the request to submit a weight, & that we added a date to that payload, so what's being written is "<Date> <Weight value>"
Now for the graph...
You've hopefully spotted that there is another file write node attached to the one that writes the data. It's really only there to create a "flag" that there is new data & that a graph should be created. Which is where incron comes in. It's used to monitor files for changes (including being created) & then executes the command specified. This is the part of my incrontab that matters here:
/home/docker/NodeRed/plot/go/kitten IN_CREATE /home/docker/NodeRed/kitten.shWhat this means is that the flag file (which NodeRed can write!) triggers incron to run a script for me (which NodeRed can't do). That script runs gnuplot, using the data file as a fixed input & the graph style set as I want it. It then deletes the flag file, which doesn't trigger icron as it's set to trigger on file creation.
gnuplot -p /home/docker/NodeRed/plot/kitten.gnu
rm /home/docker/NodeRed/plot/go/kitten/nowset title "Weight Progress"
set xlabel "Date"
set xdata time
set timefmt "%d/%m/%Y"
set xtics rotate by 60 right
set ylabel "Weight(kg)"
set grid
set size ratio 1
set key right box
set timestamp
set terminal pngcairo enhanced font "arial,10" fontscale 1.0 size 600, 400
set output '/home/docker/NodeRed/plot/kittengraph.png'
plot '/home/docker/NodeRed/plot/kitten' using 1:2 w l title ""
What does that all do? Well, kitten.sh runs gnuplot with a set of instructions that are given in kitten.gnu. Those instructions are mostly about formatting, but the last 2 lines specify the name of the output file & the name of the data file (which is the file called kitten that had the date & weight written to it just now).
Getting the graph from telegram
We set up a command to ask for the graph, which gets handled the same as all of the other commands, but leaves the switch node to a function node that contains
msg.payload.content = '/data/plot/kittengraph.png';
msg.payload.type = 'photo';
return msg;
All that you then need to do is to pass that to a telegram bot sender node & you'll get your graph :)